Graph Courses
Graph courses can help you learn about graph theory, data visualization, network analysis, and algorithm design. You can build skills in identifying relationships within data, optimizing paths, and analyzing connectivity. Many courses introduce tools like Gephi, NetworkX, and Tableau, that support visualizing complex data structures and performing in-depth analysis. By working with these tools, you'll gain practical experience in transforming raw data into meaningful insights, enhancing your ability to communicate findings effectively.
Popular Graph Courses and Certifications
 Status: Free Trial
Johns Hopkins University
Skills you'll gain: Network Analysis, Statistical Modeling, Bayesian Network, R (Software), R Programming, Social Network Analysis, Simulations, Graph Theory, Statistical Analysis, Probability & Statistics, Markov Model, Probability Distribution, Data Visualization, Machine Learning, Statistical Hypothesis Testing
 Status: Free Trial
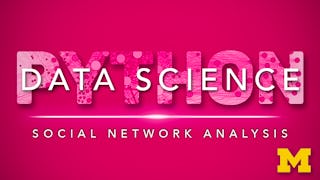
University of Michigan
Skills you'll gain: Network Analysis, Social Network Analysis, Graph Theory, Data Analysis, Analysis, Pandas (Python Package), Predictive Analytics, Unsupervised Learning, Matplotlib, Python Programming, Data Import/Export, Algorithms
 Status: Free
Amazon Web Services
Skills you'll gain: Amazon Web Services, Databases, Database Management, Database Administration, NoSQL, Database Architecture and Administration, Technical Design
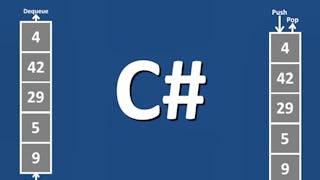
University of Colorado System
Skills you'll gain: Object Oriented Design, Unity Engine, Game Design, Software Design Patterns, Data Structures, C# (Programming Language), Video Game Development, Programming Principles, Graph Theory, Software Architecture, Algorithms, Debugging
 Status: Free Trial
Northwestern University
Skills you'll gain: Robotics, Control Systems, Artificial Intelligence, Automation, Graph Theory, Algorithms, Virtual Environment, Simulation and Simulation Software, Mathematical Modeling, Data Structures, Linear Algebra
 Status: Free Trial
University of Illinois Urbana-Champaign
Skills you'll gain: Graph Theory, Data Structures, Unstructured Data, Network Routing, Algorithms
 Status: Free Trial
University of Toronto
Skills you'll gain: Traffic Flow Optimization, Machine Controls, Automation, Robotics, Network Routing, Graph Theory, Algorithms, Computer Vision, Mathematical Modeling, Data Mapping, Predictive Modeling, Spatial Data Analysis, Control Systems, Estimation, Applied Mathematics
 Status: Free Trial
Johns Hopkins University
Skills you'll gain: Applied Mathematics, Estimation, Numerical Analysis, Calculus, Engineering Calculations, Mathematical Modeling, Operations Research, Derivatives, Algebra
 Status: Free Trial
Stanford University
Skills you'll gain: Algorithms, Graph Theory, Data Structures, Theoretical Computer Science, Computational Thinking, Analysis, Computer Science, Probability
 Status: New
Skills you'll gain: Virtual Reality, UI Components
 Status: Free Trial
University of Illinois Urbana-Champaign
Skills you'll gain: Big Data, Apache Spark, Apache Hadoop, Apache Mahout, Distributed Computing, Data Storage, Data Processing, NoSQL, Apache Kafka, Real Time Data, Cloud Computing, Databases, Analytics, Deep Learning, Scalability, Machine Learning Algorithms, Graph Theory, Machine Learning

Skills you'll gain: Graph Theory, Javascript, Program Development, Programming Principles, Software Design Patterns, Computational Thinking, Debugging, Development Environment, Computer Science, Performance Tuning
In summary, here are 10 of our most popular graph courses
- Computational and Graphical Models in Probability: Johns Hopkins University
- Applied Social Network Analysis in Python: University of Michigan
- Getting Started with Amazon Neptune: Amazon Web Services
- Data Structures and Design Patterns for Game Developers: University of Colorado System
- Modern Robotics, Course 4: Robot Motion Planning and Control: Northwestern University
- Unordered Data Structures: University of Illinois Urbana-Champaign
- Motion Planning for Self-Driving Cars: University of Toronto
- Calculus through Data & Modeling: Applying Differentiation: Johns Hopkins University
- Divide and Conquer, Sorting and Searching, and Randomized Algorithms: Stanford University
- Unreal Engine 5 Environments – Artist Bootcamp: Packt


