Seaborn Courses Online
Master Seaborn for data visualization in Python. Learn to create informative and attractive statistical graphics.
Explore the Seaborn Course Catalog
 Status: Free Trial
Skills you'll gain: Data Visualization Software, Plotly, Data Visualization, Dashboard, Interactive Data Visualization, Matplotlib, Seaborn, Data Presentation, Data Analysis, Geospatial Information and Technology, Pandas (Python Package), Scatter Plots, Histogram, Heat Maps, Box Plots, Python Programming
 Status: Preview
Skills you'll gain: Seaborn, Data Storytelling, Statistical Visualization, Data Visualization, Data Visualization Software, Matplotlib, Box Plots, Scatter Plots, Statistical Analysis, Heat Maps, Histogram, Python Programming

Skills you'll gain: Matplotlib, Histogram, Plot (Graphics), Data Visualization, Seaborn, Scatter Plots, Data Visualization Software, Statistical Visualization, Graphing, Python Programming

Skills you'll gain: Matplotlib, Seaborn, Plot (Graphics), Scatter Plots, Histogram, Data Visualization, Data Visualization Software, Statistical Visualization, Data Analysis, Python Programming
Skills you'll gain: Matplotlib, Data Visualization, Seaborn, Exploratory Data Analysis, NumPy, Data Analysis, Jupyter, Data Science, Machine Learning, Python Programming, Supervised Learning, Algorithms
 Status: Free Trial
Duke University
Skills you'll gain: Data Visualization Software, Data Visualization, Data Storytelling, Interactive Data Visualization, Plotly, Matplotlib, Dashboard, Seaborn, Tableau Software, Scatter Plots, Histogram, Google Sheets, Microsoft Excel, Data Analysis, Pandas (Python Package), Python Programming, Cloud Applications, Data Manipulation, Business Communication
What brings you to Coursera today?
 Status: Free Trial
University of Colorado Boulder
Skills you'll gain: Matplotlib, Seaborn, Plot (Graphics), Pandas (Python Package), NumPy, Data Visualization Software, Data Visualization, Data Manipulation, Data Science, Histogram, Package and Software Management, Data Import/Export, Python Programming
Skills you'll gain: Exploratory Data Analysis, Correlation Analysis, Matplotlib, Seaborn, Data Cleansing, Data Visualization, Pandas (Python Package), Data Analysis, Data Manipulation, NumPy, Statistical Analysis, Python Programming
 Status: Free Trial
University of Colorado Boulder
Skills you'll gain: Matplotlib, Statistical Visualization, Seaborn, Data Visualization, Exploratory Data Analysis, Data Presentation, Plot (Graphics), Data Visualization Software, Descriptive Statistics, Data Storytelling, Pandas (Python Package), Statistical Methods, Data Analysis, Statistics, Statistical Analysis, Data Manipulation, Box Plots, Scatter Plots, Correlation Analysis, Python Programming
 Status: NewStatus: Free Trial
Skills you'll gain: Seaborn, Data Literacy, Plot (Graphics), Matplotlib, Scatter Plots, Statistical Visualization, Data Presentation, Data Visualization Software, Data Visualization, Box Plots, Exploratory Data Analysis, Data Storytelling, Data Processing, Data-Driven Decision-Making, Statistical Modeling, Statistical Analysis, Descriptive Statistics, Pandas (Python Package), NumPy, Python Programming
 Status: NewStatus: Free Trial
Skills you'll gain: Unsupervised Learning, Seaborn, Matplotlib, Predictive Modeling, Supervised Learning, NumPy, Applied Machine Learning, Predictive Analytics, Dimensionality Reduction, Random Forest Algorithm, PyTorch (Machine Learning Library), Deep Learning, Keras (Neural Network Library), Scatter Plots, Tensorflow, Data Visualization Software, Python Programming, Data Science, Machine Learning, Data Analysis
 Status: NewStatus: Preview
Skills you'll gain: Tensorflow, Scikit Learn (Machine Learning Library), Machine Learning, Feature Engineering, Deep Learning, Matplotlib, Jupyter, Python Programming, Data Processing, NumPy, Data Cleansing, Image Analysis, Artificial Neural Networks, Seaborn, Development Environment, Pandas (Python Package), Regression Analysis
Seaborn learners also search
In summary, here are 10 of our most popular seaborn courses
- Data Visualization with Python: IBM
- Seaborn: Visualizing Basics to Advanced Statistical Plots: Coursera
- Python for Data Visualization: Matplotlib & Seaborn: Coursera
- Python for Data Visualization:Matplotlib & Seaborn(Enhanced): Coursera
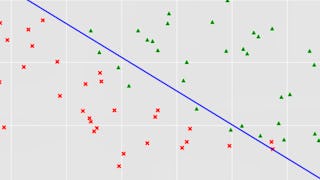
- Logistic Regression with NumPy and Python: Coursera
- Data Visualization with Python: Duke University
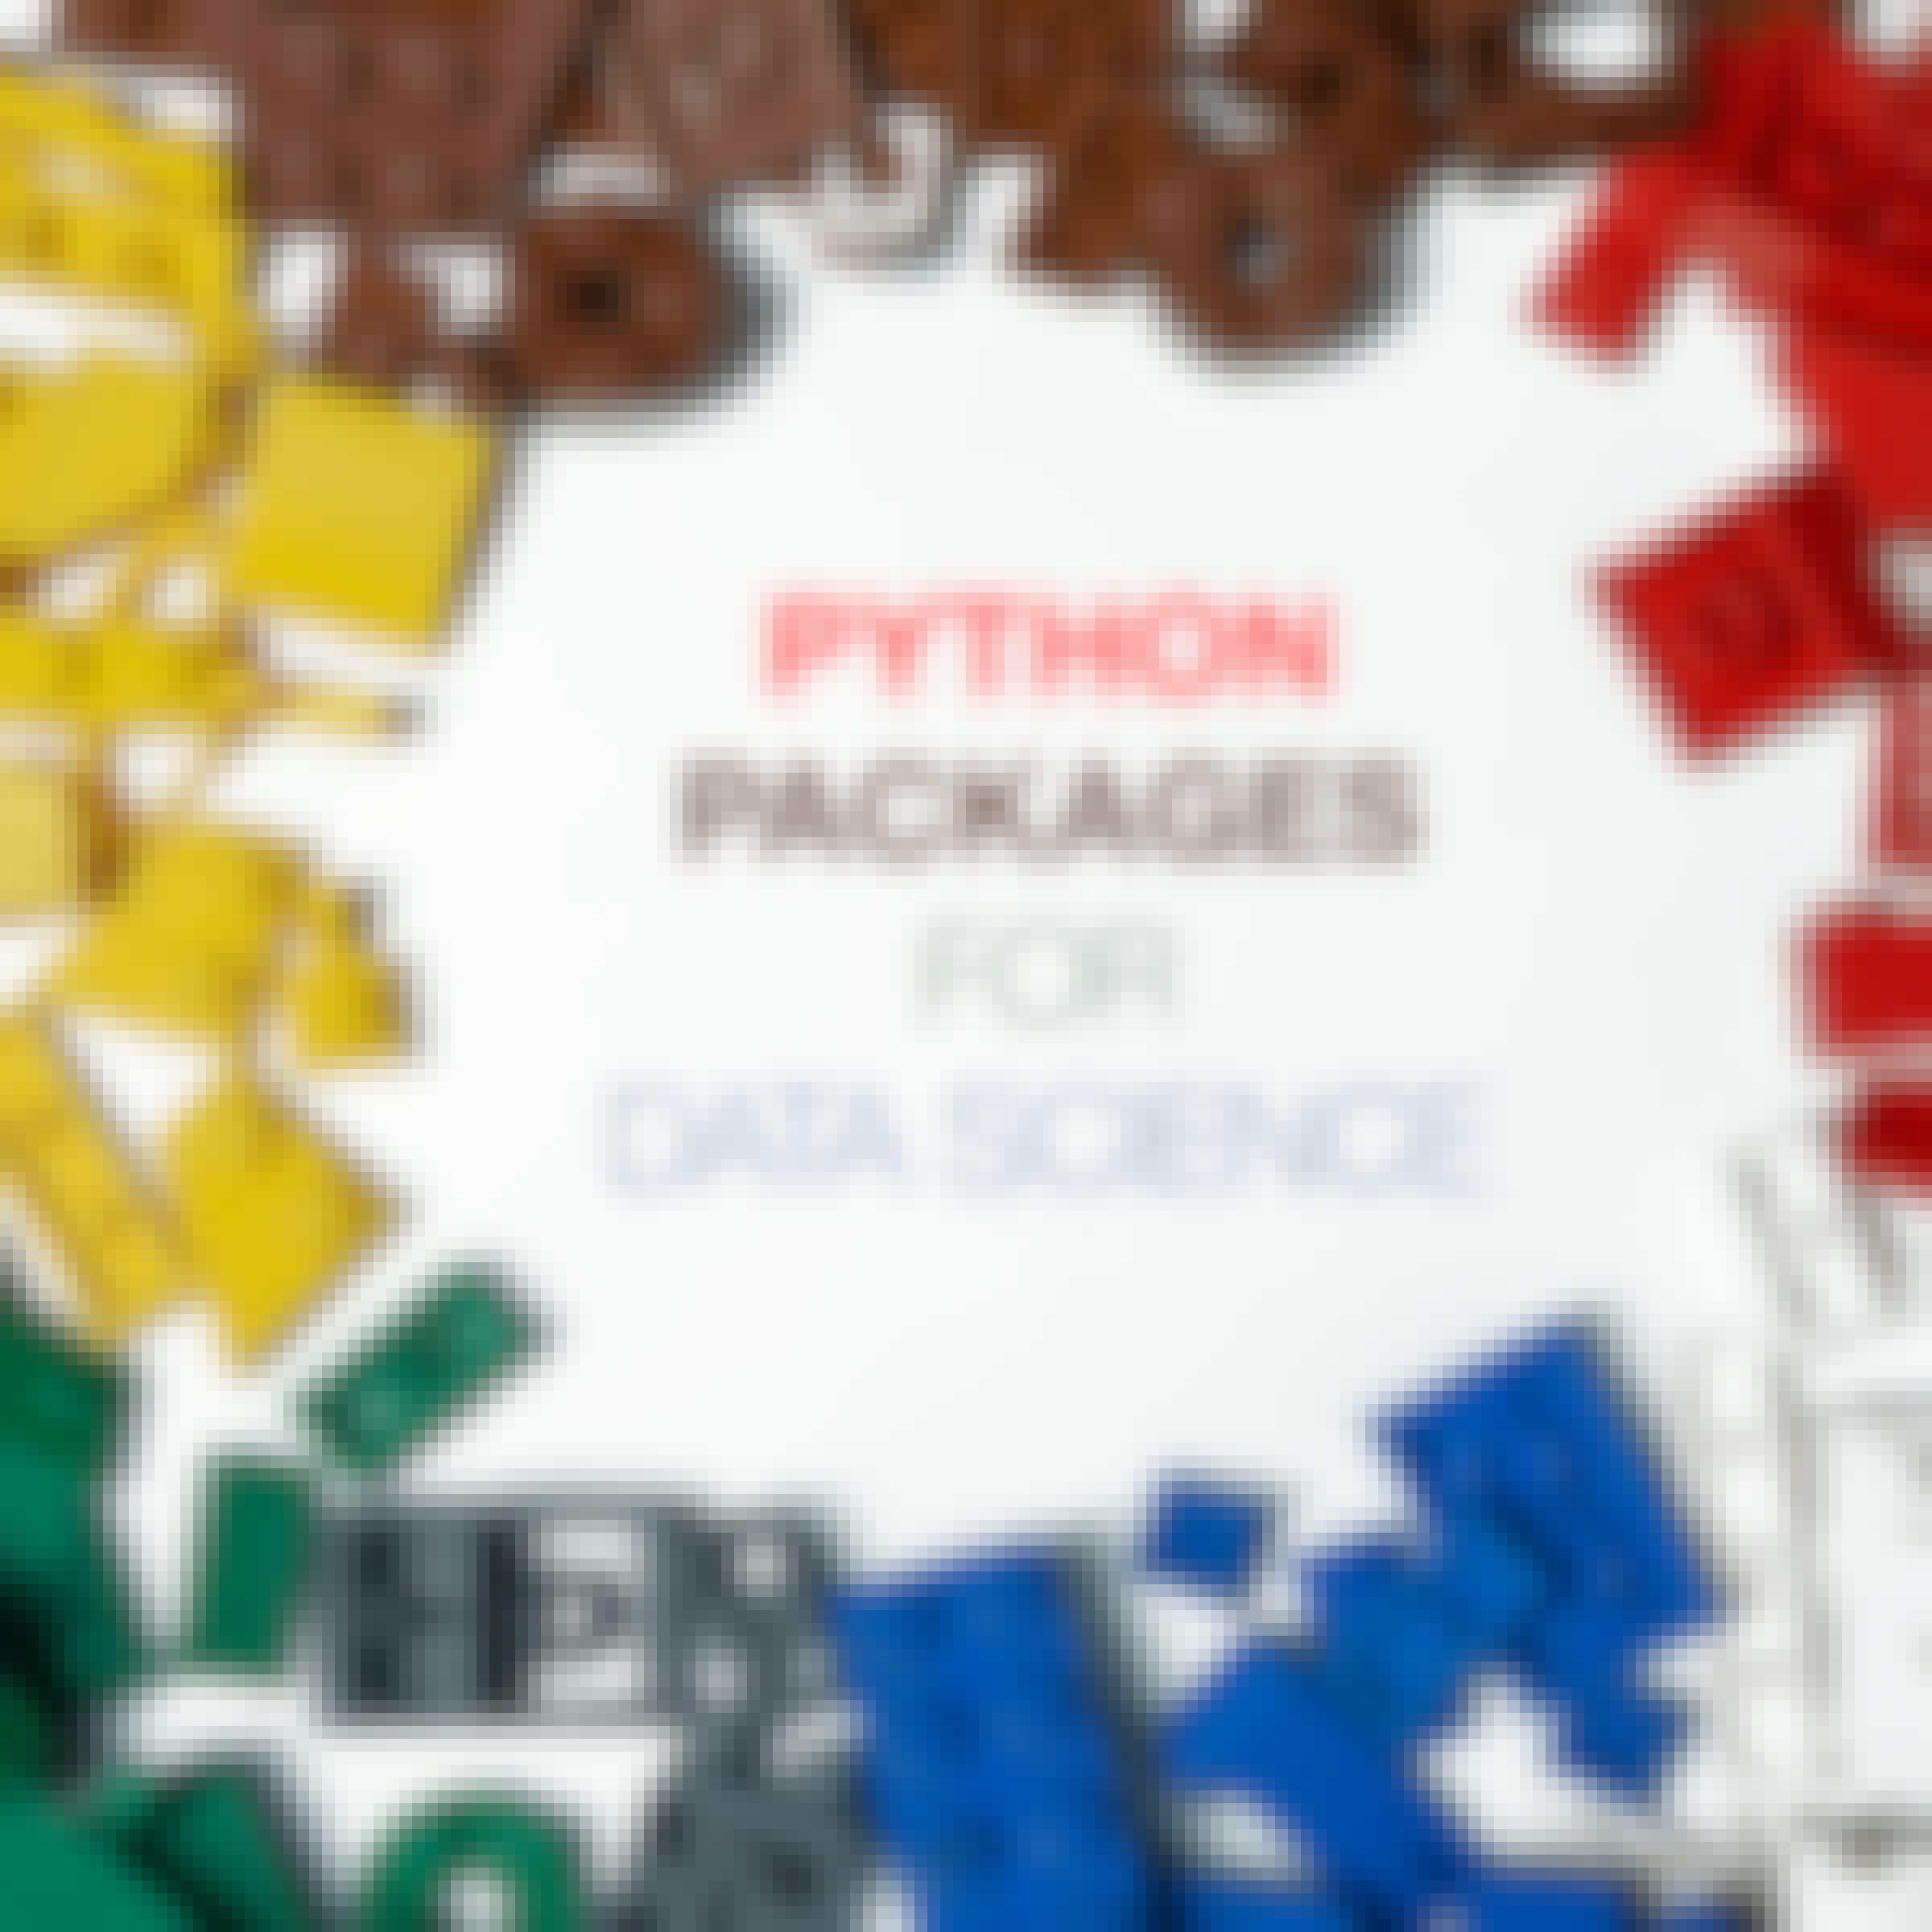
- Python Packages for Data Science: University of Colorado Boulder
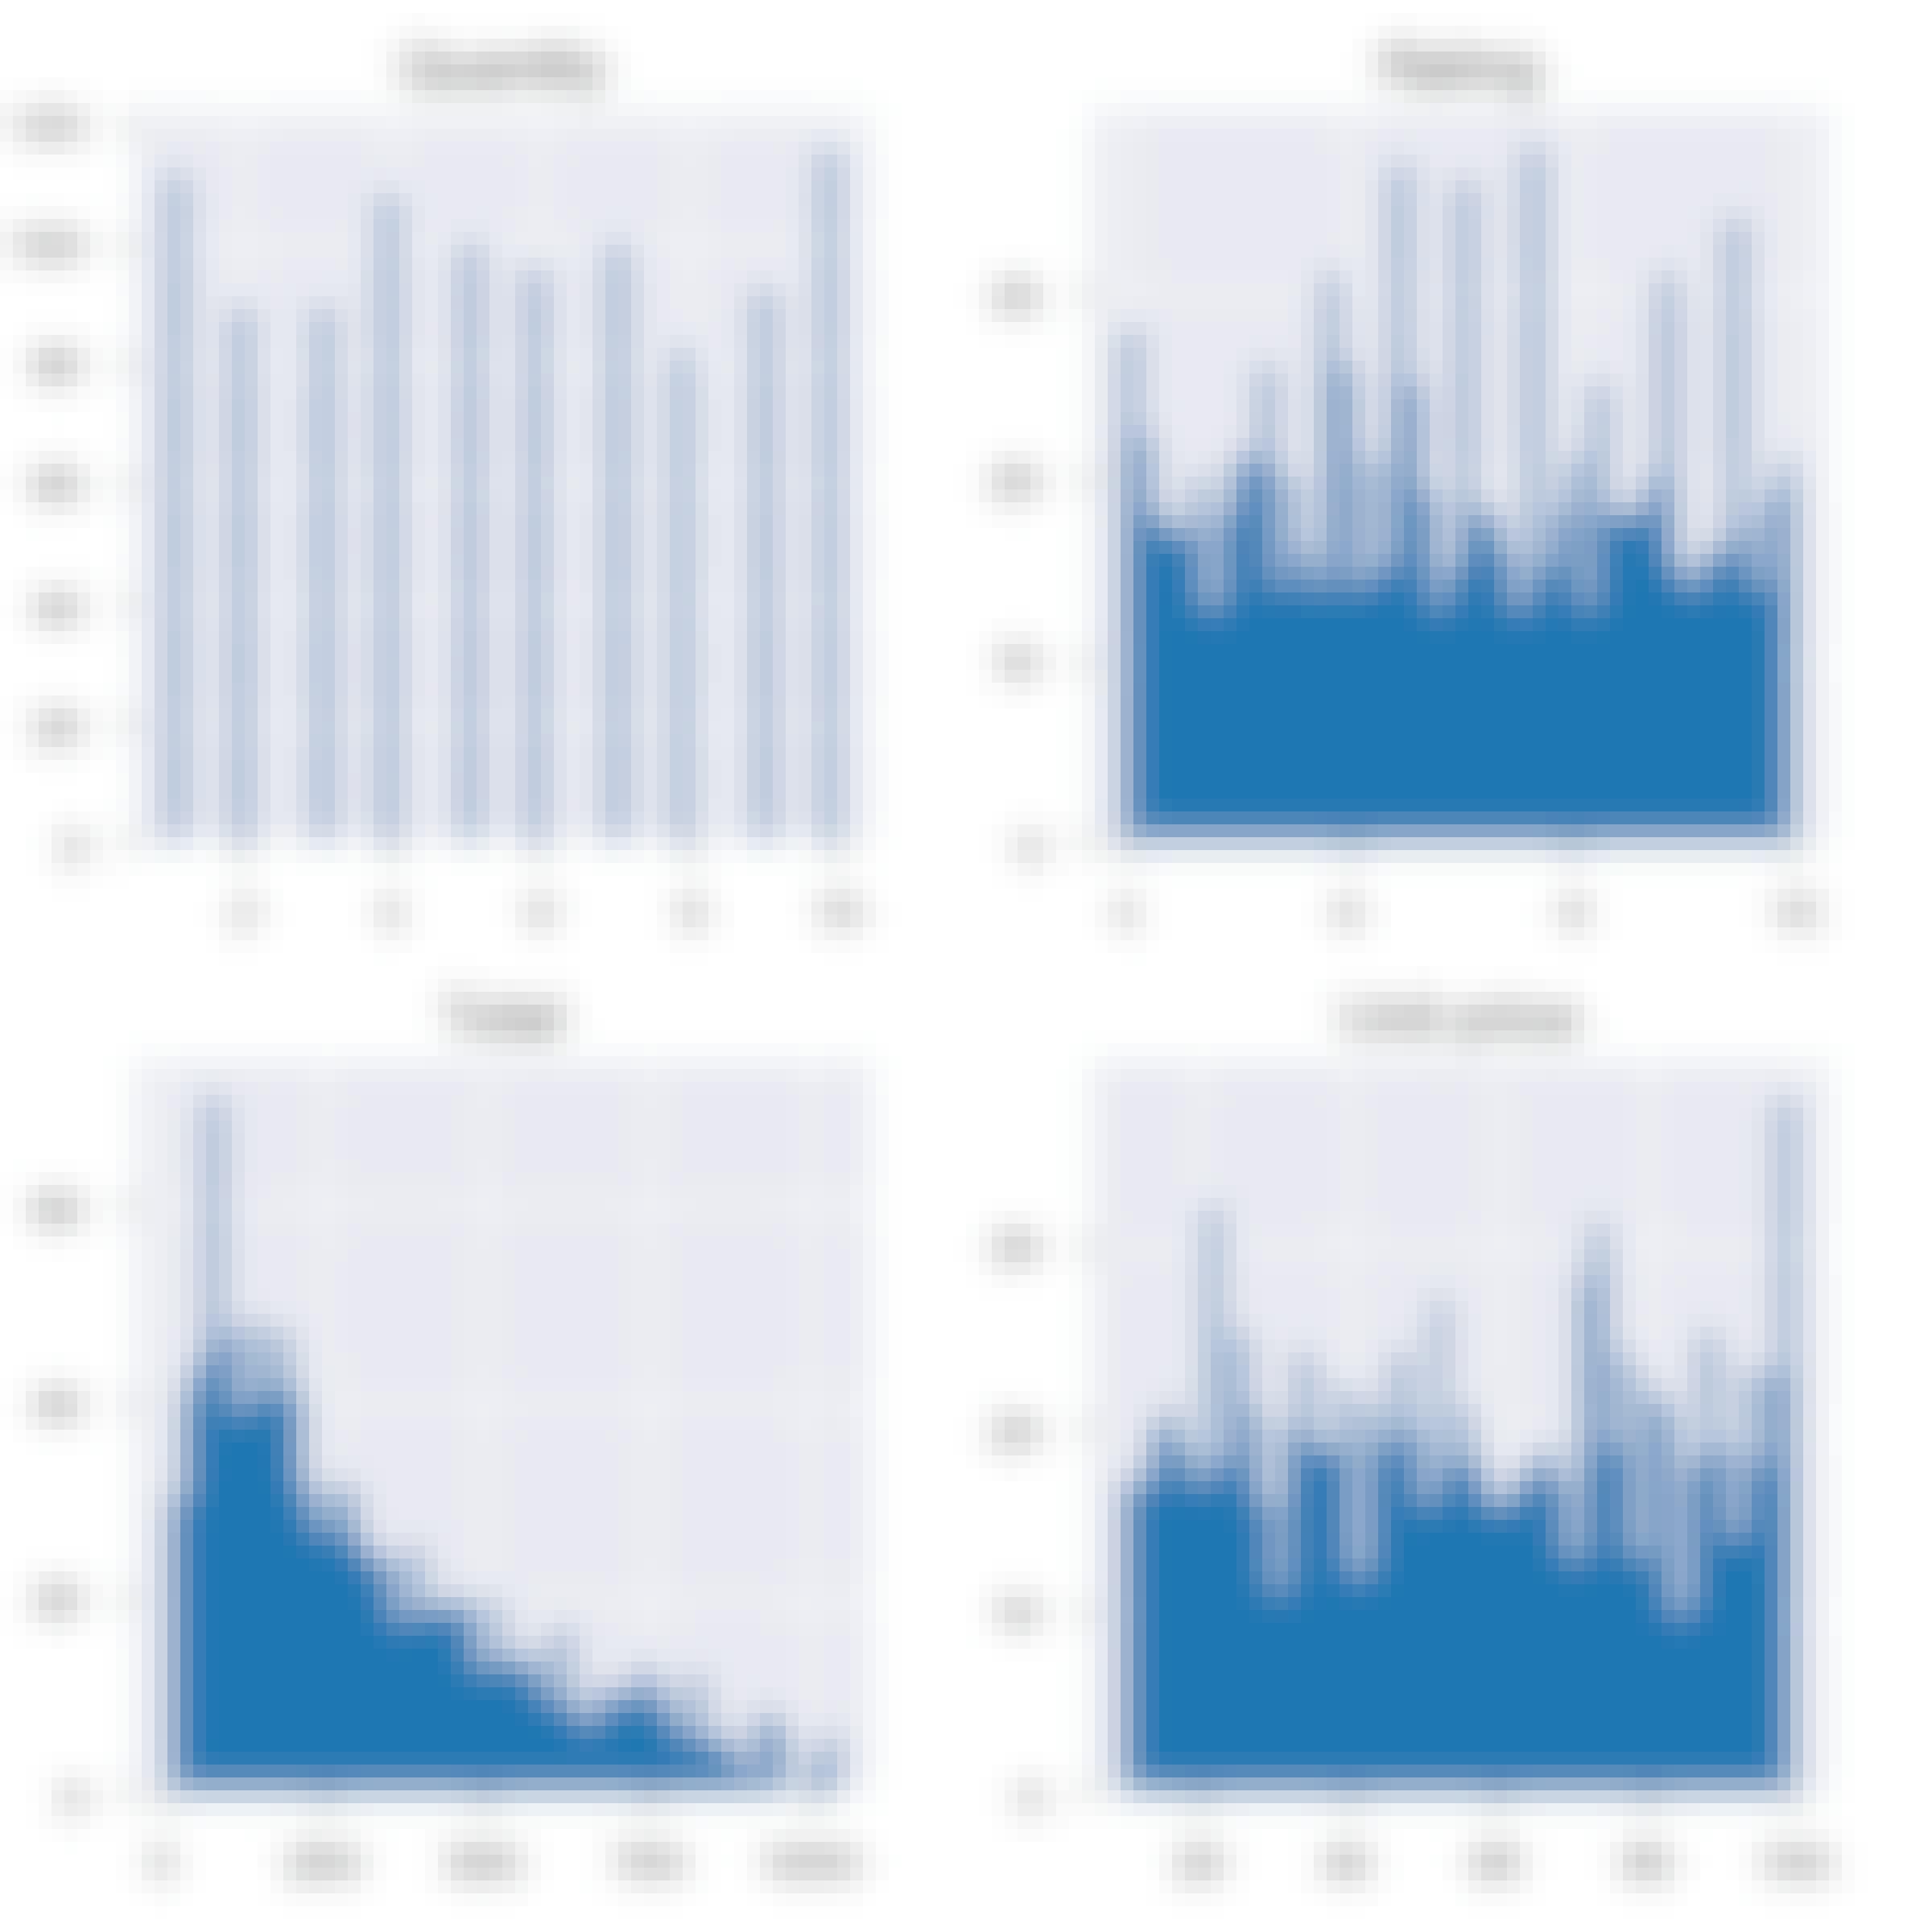
- Exploratory Data Analysis With Python and Pandas: Coursera
- Data Understanding and Visualization: University of Colorado Boulder
- Seaborn Python Data Visualization & Analysis: EDUCBA


