
Scientific Visualization
Most popular
 Status: Preview
University of Arizona
 Status: Free Trial
University of Toronto
 Status: Preview
The University of Tokyo
 Status: Free Trial
Rice University
Trending now
 Status: Free Trial
University of Michigan
- Status: Free Trial
University of Toronto
- Status: Preview
University of Arizona
- Status: Free Trial
Rice University
New releases
 Status: Free Trial
 Status: Free Trial
 Status: Free Trial
 Status: Free Trial
Filter by
SubjectRequired
LanguageRequired
The language used throughout the course, in both instruction and assessments.
Learning ProductRequired
LevelRequired
DurationRequired
SubtitlesRequired
EducatorRequired
Results for "scientific visualization"
 Status: Free Trial
University of Colorado Boulder
Skills you'll gain: Design Strategies, Mathematics Education, Simulations, Simulation and Simulation Software, User Feedback, Scientific Visualization, Display Devices

Coursera Project Network
Skills you'll gain: Image Analysis, Software Installation, Data Analysis, Analysis, Scientific Visualization, User Interface (UI)
 Status: Preview
University of Cape Town
Skills you'll gain: Jupyter, Statistical Analysis, Data Visualization, Plot (Graphics), Scientific Visualization, Exploratory Data Analysis, Data Manipulation, Data Science, Other Programming Languages, Statistical Hypothesis Testing, Computer Programming, Mathematical Modeling, Package and Software Management
 Status: Preview
Universidade de São Paulo
Skills you'll gain: Network Analysis, Social Network Analysis, Data Visualization, Scientific Visualization, Graph Theory, Exploratory Data Analysis, Environmental Science, Data Analysis, R Programming, Data Science, Mathematical Modeling
Coursera Project Network
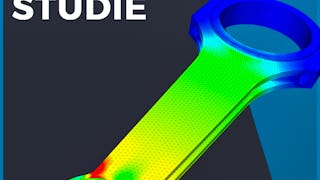
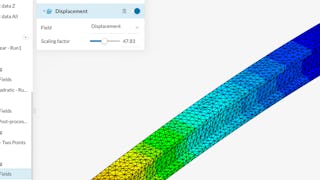
Skills you'll gain: Finite Element Methods, Simulation and Simulation Software, Simulations, Mathematical Modeling, Engineering Analysis, 3D Modeling, Scientific Visualization, Cloud Computing, Structural Analysis
Coursera Project Network
Skills you'll gain: Finite Element Methods, Simulation and Simulation Software, Data Validation, Simulations, Engineering Analysis, Verification And Validation, Engineering Calculations, Mechanical Engineering, Scientific Visualization, Physics
 Status: Preview
University of Colorado Boulder
Skills you'll gain: Physics, General Science and Research, Scientific Methods, Environment, Scientific Visualization, Safety Assurance, Simulations, Personal protective equipment
 Status: Free Trial
Dartmouth College
Skills you'll gain: Biology, 3D Assets, Anthropology, Anatomy, Scientific Methods, Taxonomy, Visualization (Computer Graphics), Life Sciences, Scientific Visualization, Ancient History, Research, Augmented and Virtual Reality (AR/VR), Spatial Data Analysis, Estimation
 Status: Free Trial
Skills you'll gain: Matplotlib, Linear Algebra, NumPy, Scientific Visualization, Machine Learning Algorithms, Pandas (Python Package), Seaborn, Data Science, Machine Learning, Data Analysis, Supervised Learning, Python Programming, Scikit Learn (Machine Learning Library), Jupyter, Data Manipulation, Regression Analysis, Data Structures, Software Installation

Skills you'll gain: Tensorflow, Data Collection, Image Analysis, Artificial Neural Networks, Deep Learning, Computer Vision, Google Cloud Platform, Cloud Computing, Scientific Visualization
 Status: Free Trial
Korea Advanced Institute of Science and Technology(KAIST)
Skills you'll gain: Electrical Engineering, Electronic Components, Materials science, Engineering Analysis, Finite Element Methods, Applied Mathematics, Scientific Visualization, Engineering Calculations, Semiconductors, Differential Equations, Physics, Energy and Utilities, Mathematical Modeling, Calculus
 Status: NewStatus: Preview
American Museum of Natural History
Skills you'll gain: Scientific Visualization, Environment, Physics, General Science and Research, Taxonomy, Scientific Methods, Biology, Chemistry


