Data Visualization Courses
Data visualization courses can help you learn how to create compelling charts, graphs, and dashboards, along with understanding data storytelling and visual design principles. You can build skills in interpreting data trends, selecting appropriate visual formats, and conveying insights effectively to diverse audiences. Many courses introduce tools like Tableau, Power BI, and D3.js, that support transforming raw data into visual narratives and making data-driven decisions in various fields.
Popular Data Visualization Courses and Certifications
 Status: Free Trial
University of Washington
Skills you'll gain: Classification Algorithms, Applied Machine Learning, Logistic Regression, Supervised Learning, Predictive Modeling, Decision Tree Learning, Data Preprocessing, Model Evaluation, Text Mining, Machine Learning Algorithms, Scalability, Machine Learning, Natural Language Processing, Big Data, Probability & Statistics, Algorithms
 Status: NewStatus: Free Trial
Skills you'll gain: Apache Hadoop, Apache Hive, Big Data, Data Analysis, Data Processing, Query Languages, Unstructured Data, Data Transformation, Data Cleansing, Scripting
 Status: NewStatus: Preview
University of Leeds
Skills you'll gain: General Science and Research, Analytical Skills, Data Science, Communication, Technical Communication, Record Keeping, Critical Thinking, Technical Writing
 Status: New
Skills you'll gain: Apache Airflow, MLOps (Machine Learning Operations), Multi-Tenant Cloud Environments, Data Pipelines, Workflow Management, Business Workflow Analysis, Cloud Deployment, Continuous Deployment, CI/CD, Devops Tools, DevOps, Configuration Management, Python Programming, Scalability, Performance Tuning, System Monitoring
 Status: NewStatus: Free Trial
Skills you'll gain: AI Workflows, Technical Communication, AI Enablement, Model Deployment, Generative AI Agents, Data Integration, AI Orchestration, Reinforcement Learning, Artificial Intelligence and Machine Learning (AI/ML), Agentic systems, Responsible AI, Artificial Intelligence, Cloud Computing, Deep Learning, Data Visualization, Python Programming, Machine Learning, Data Engineering, Anomaly Detection, Statistical Analysis
 Status: New
Skills you'll gain: Excel Formulas, Microsoft Excel, Spreadsheet Software, Pivot Tables And Charts, Statistical Analysis, Data Manipulation, Descriptive Statistics, Data Analysis, Data Cleansing, Data Presentation
 Status: NewStatus: Free Trial
Skills you'll gain: MLOps (Machine Learning Operations), Data Integrity, Data Quality, Data Maintenance, System Monitoring, Machine Learning, Artificial Intelligence and Machine Learning (AI/ML), Artificial Intelligence
 Status: Free Trial
University of California, Davis
Skills you'll gain: Data Visualization, Advanced Analytics, Tableau Software, Interactive Data Visualization, Data Visualization Software, Data Storytelling, Data Mapping, Pivot Tables And Charts, Tree Maps, Analytics, Data Analysis Expressions (DAX), Histogram, Scatter Plots, Geospatial Mapping, Heat Maps, Forecasting
 Status: NewStatus: Free Trial
Skills you'll gain: Healthcare Ethics, Health Informatics, Machine Learning, Deep Learning, Machine Learning Software, Clinical Informatics, Statistical Machine Learning, Convolutional Neural Networks, Data Preprocessing, Predictive Modeling, Electronic Medical Record System, Machine Learning Algorithms, Recurrent Neural Networks (RNNs), Model Evaluation, Data Analysis
 Status: Free Trial
Skills you'll gain: Prompt Engineering, Prompt Patterns, ChatGPT, Generative AI, Responsible AI, Business Analysis, Data-Driven Decision-Making, Data Analysis, AI Enablement, Data Storytelling, Artificial Intelligence, Business Process Automation, Stakeholder Communications, Prototyping, Artificial Intelligence and Machine Learning (AI/ML), AI Workflows, Deep Learning, Business Strategy, Machine Learning, Context Management
 Status: NewStatus: Free Trial
Skills you'll gain: Performance Tuning, Splunk, Role-Based Access Control (RBAC), Application Performance Management, System Monitoring, Distributed Computing, System Configuration, Data Management, Security Information and Event Management (SIEM), Enterprise Security, Data Security, Event Monitoring, Scalability, Data Pipelines, Real Time Data, Authentications
 Status: NewStatus: Free Trial
Real Madrid Graduate School Universidad Europea
Skills you'll gain: Applied Machine Learning, Image Analysis, Computer Vision, Analytics, Real Time Data, AI Enablement, Reinforcement Learning, Large Language Modeling, Advanced Analytics, Data-Driven Decision-Making, AI Workflows, Machine Learning, Artificial Intelligence, Analysis, Automation, Supervised Learning, Natural Language Processing, Data Presentation, Innovation, Data Collection
In summary, here are 10 of our most popular data visualization courses
- Machine Learning: Classification: University of Washington
- Hadoop Projects: Apply MapReduce, Pig & Hive: EDUCBA
- Data Science: How to Plan Projects, Research and Reflect: University of Leeds
- Apache Airflow Best Practices: Packt
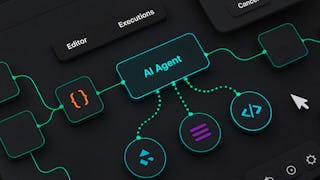
- Build AI Agents with Practical App Design: LearnQuest
- Excel Functions and Formulas: Packt
- Partition & Monitor AI Models Effectively: Coursera
- Visual Analytics with Tableau: University of California, Davis
- Machine Learning for Medical Data : SkillUp
- Generative AI for Business Analysts: IBM


