
Data Presentation
Most popular
 Status: Free TrialStatus: AI skills
Google
 Status: Free Trial
 Status: Free Trial
 Status: Free Trial
Trending now
- Status: Free TrialStatus: AI skills
Google
 Status: Free Trial
 Status: Free Trial
 Status: Free Trial
New releases
 Status: Free Trial
University of Pittsburgh
 Status: Free Trial
 Status: Free Trial
University of Colorado Boulder
 Status: Free Trial
Filter by
SubjectRequired
LanguageRequired
The language used throughout the course, in both instruction and assessments.
Learning ProductRequired
LevelRequired
DurationRequired
SubtitlesRequired
EducatorRequired
Results for "data presentation"
 Status: Preview
Johns Hopkins University
Skills you'll gain: Health Policy, Data Presentation, Health Disparities, Health Equity, Health Informatics, Data Literacy, Epidemiology, Data Quality, Public Health, Data-Driven Decision-Making, Policy Analysis, Data Analysis, Data Visualization Software

Coursera Project Network
Skills you'll gain: Google Sheets, Spreadsheet Software, Data Import/Export, Data Analysis Software, Data Presentation, Data Analysis, Business Analysis
 Status: Free Trial
University of Maryland, College Park
Skills you'll gain: Data Storytelling, Data Presentation, Data Visualization, Digital Transformation, Persuasive Communication, Data Science, Storytelling, Influencing, Data-Driven Decision-Making, Customer Engagement, Presentations, Analytics, Customer Insights
 Status: Preview
Knowledge Accelerators
Skills you'll gain: Data Modeling, Data Visualization, Power BI, Data Visualization Software, Dashboard, Data Presentation, Interactive Data Visualization, Data Import/Export, Data Analysis, Data Analysis Expressions (DAX), Data Synthesis, Business Intelligence, Data Transformation, Trend Analysis, Data Sharing, Excel Formulas, Business Analytics, Microsoft 365
 Status: Free
Coursera Project Network
Skills you'll gain: Anthropic Claude, Business Intelligence, Data Presentation, Data Visualization, Data Storytelling, Trend Analysis, Sales, Business Analytics, Sales Strategy, Data-Driven Decision-Making, Data Analysis, Business Strategy, Business Analysis, LLM Application
Coursera Project Network
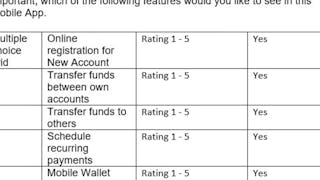
Skills you'll gain: User Research, User Feedback, Project Scoping, Data Presentation, Analysis, Data Analysis, Mobile Banking, Data Collection
 Status: Free Trial
Google Cloud
Skills you'll gain: Looker (Software), Dashboard, Pivot Tables And Charts, Data Presentation, Data Analysis, Data Visualization Software, Data-Driven Decision-Making, Data Sharing, Ad Hoc Reporting, Data Manipulation
 Status: Free Trial
Skills you'll gain: R Programming, Alteryx, Statistical Programming, Tableau Software, Data Cleansing, Data Visualization Software, Dashboard, Data Visualization, Data Storytelling, Interactive Data Visualization, Data Presentation, Data Structures, Statistical Analysis, Workflow Management, Data Analysis, Data Processing, Data Manipulation, Data Transformation, Data Import/Export

Google Cloud
Skills you'll gain: Data Presentation, Data Visualization Software, Query Languages, Data Integration, Data Analysis
 Status: NewStatus: Free Trial
Skills you'll gain: Microsoft Excel, Data Presentation, Data Storytelling, Predictive Modeling, Data Visualization Software, Data Synthesis, Spreadsheet Software, Microsoft Copilot, Excel Formulas, Dashboard, Predictive Analytics, Data Analysis, Report Writing, Data-Driven Decision-Making, Forecasting, Prompt Engineering, Data Manipulation, Data Transformation, Trend Analysis, Data Cleansing

Alfaisal University | KLD
Skills you'll gain: Data Presentation, Data Storytelling, Data Visualization, Storytelling, Data Visualization Software, Graphing, Data Literacy, Presentations, Business Reporting
 Status: Free Trial
University of Michigan
Skills you'll gain: Data Ethics, Policy Analysis, Analytical Skills, Case Studies, Data Analysis, Responsible AI, Public Policies, Data Presentation, Data-Driven Decision-Making, Ethical Standards And Conduct, Data Governance, R Programming, Machine Learning, Predictive Modeling


